In the August 2009 issue of Underhood Service, I covered many basic scan tool operations including correctly identifying the vehicle, communicating with various on-board modules, interpreting serial data screens and identifying modules. (Click here to view that article: https://www.underhoodservice.com/Article/62126/getting_the_most_data_from_your_scan_tool.aspx
I also stressed the importance of getting the most out of your aftermarket scan tool by spending a few minutes each day practicing with each of its various features. 
This month I’d like to discuss the importance of choosing the right scan tool, using scan tool database systems, graphing data, storing data for future use, analyzing scan tool data and using bi-directional controls.
Choosing a Scan Tool
Before you invest your hard-earned money in an aftermarket scan tool, it’s important to understand the capabilities and technical focus of the scan tool. Obviously, no single OE or aftermarket scan tool has the capability to be everything to every vehicle. OE scan tools, for example, are dedicated to servicing a single manufacturer’s line of vehicles. While OE tools make OE-level diagnostics, programming and module initialization available to independent shops, they generally can’t be used for other manufacturers’ lines.
Aftermarket scan tools, on the other hand, are designed to deal with the largest percentage of
common problems found in domestic, Asian and European product lines. Some aftermarket scan tools are heavily invested in OE-level diagnostic capability while others are more invested in specialized domestic, Asian or European vehicle diagnostics. 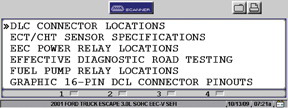
Other scan tools have a very good Mode $06 diagnostics capability. Mode $06, of course, is an engineering-level, predictive diagnostic mode expressed in a scientific hexadecimal mathematics system. Many of these scan tools automatically convert Mode $06 hexadecimal mathematics into everyday language that a technician can easily understand and use to evaluate a particular diagnostic situation.
Aftermarket scan tools are now available that contain some very expansive (and expensive) diagnostic capabilities, such as wireless communications, extensive databases, and the ability to simultaneously graph all PCM inputs and outputs.
While it’s not possible to cover the diagnostic capabilities of high-end scanners in this space, suffice it to say that buying an expensive scan tool won’t compensate for the lack of skill and knowledge on the part of the user. 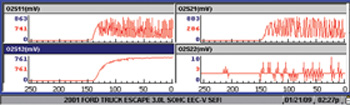
Any potential scan tool purchaser should buy according to his immediate training and diagnostic needs. If you’re a beginning general repair technician, you’re likely to never use the total capacity of a high-end aftermarket scan tool until you’ve acquired an adequate knowledge of vehicle operating systems and have several years of comprehensive diagnostic experience under your belt.
If you’re an experienced ASE-Certified Master Technician with the L-1 Advanced Engine Performance certification, then you’re probably going to be looking at that high-end aftermarket scan tool. If you’re a domestic, Asian or European nameplate specialist, you’ll probably find that the OE scan tool is your best diagnostic investment. If you’re a general line tech, it pays to have a good aftermarket scan tool in your tool box to use when the shop’s scan tools are being used by other techs.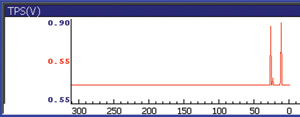
Scan Tool Databases
Several major aftermarket scan tools feature extensive diagnostic information databases within their service menus. Although the format of these databases might vary from year to year, one manufacturer might focus on service tips and technical service bulletins while another might use information derived from a technical hot line and archival database.
In any case, it’s important to routinely access and use these databases to diagnose even the most common engine driveability and powertrain failures. For example, when I ventured back into automatic transmission diagnosis 10 years ago, I found that ignition switch failures on General Motors trucks were a primary cause of malfunctions on GM electronic automatic transmissions by searching trouble-shooting data contained in my scan tool database.
In some cases, a scan tool might contain routine diagnostic and service data such as fuel pump pressure and various sensor voltage values.
In other cases, a scan tool might contain critical technical service bulletin data such as the need to reprogram a PCM after replacing a particular sensor. Scan tool databases can be very valuable time savers and should never be ignored when diagnosing and repairing even the most common electronic failure. 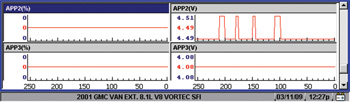
Graphing Data
Graphing serial data allows a technician to compare the relative activity of various inputs and outputs to the PCM. The most common example would be graphing upstream and downstream oxygen sensor data to compare the
relative activity of the upstream and downstream oxygen sensors.
First off, a graph allows us to see the oxygen sensor heaters simultaneously activate the oxygen sensors. Second, comparing the relative activity of the upstream and downstream sensors allows us to observe the basic efficiency of the catalytic converter.
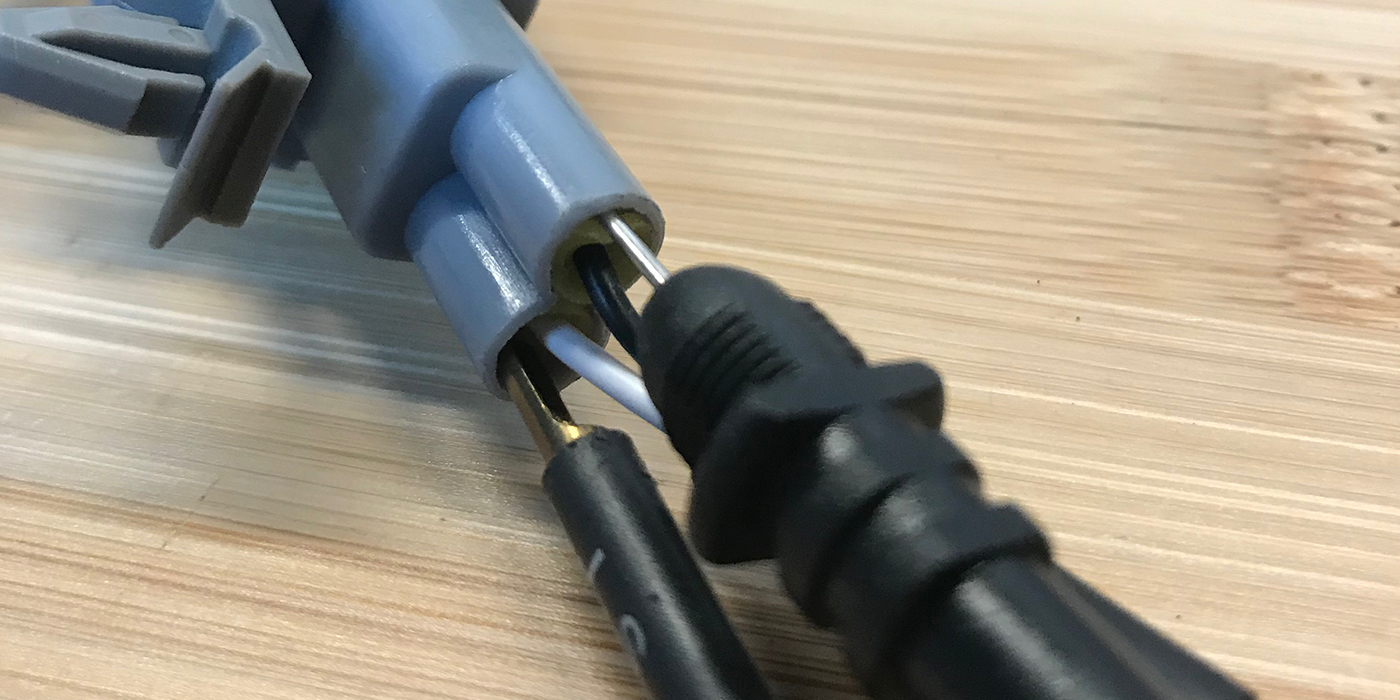
In addition, a graph allows us to capture a “movie” of variations in circuit voltage. Many times I’ve used graphs to detect intermittent and random breaks in wiring circuits by simply wiggling or stressing the wire while the scan tool is graphing the voltage.
I used this feature to diagnose an electronic throttle issue on a 2003 GMC passenger van that resulted in a P1221 trouble code. In summary, P1221 is stored when the #2 throttle position (TP) sensor input disagrees with the #1 TP input by more than 7.5% for less than one second. When the throttle control (TAC) module detects excessive variations in the #1 and #2 TP voltage inputs, it limits engine speed to about 1,500 rpm, which allows the vehicle to be driven only 10-20 miles per hour, depending upon the road grade and rolling resistance of the vehicle. 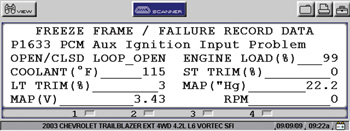
This particular vehicle had most of the electronic throttle control parts replaced under manufacturer’s warranty and the owner had spent several thousand dollars of his own money trying to have the problem repaired in several independent shops.
I originally thought the scan tool graph would illustrate exactly which sensor circuit was spiking or dropping out in voltage. Quite to the contrary, the data stream graph simply wasn’t fast enough to capture small and instantaneous drops or spikes in voltage. But the graph was showing some “hash” or “fuzz” in the voltage line as the engine idled at least for 10-15 minutes. The hash wasn’t approaching 7.5% limit, but was showing voltage variation in the APP2 circuit at closed throttle.
Here we get into a gray area that’s more subjective than objective. On rare occasions, I’ve seen this kind of fuzzy voltage line be caused by bad computer pin connections or bad contacts. I say “gray area” because this type of graph data isn’t always a definitive diagnosis.
But I noticed that an oil cooler line had been wedged between the two TAC module connectors that connected the TAC to the TP and throttle pot assemblies. Re-routing the cooler line and coating the connector pins with some Stabilant 22 removed the hash from the graph lines. As of this writing six months later, the vehicle is still fixed. 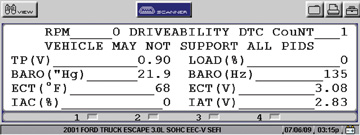
Recording Data
At this point, I’d also like to emphasize the importance of saving data. I find it particularly convenient to save serial data screens, freeze-frame information, voltage graphs and even trouble code lists for future reference.
Although the actual process varies from tool to tool, most scan tools can store a number of screens for future reference. In the case of the Snap-on Vantage Pro and scan tools using a compact flash (CF) card for data storage, this information can be easily downloaded to a personal computer by using an inexpensive flash card reader to download the card or by directly downloading to the computer with applicable software and cable connections.
Serial Data Analyses
At the outset, it’s always a good idea to incorporate data analysis as part of a diagnostic routine. When the vehicle is in the key-on, engine off (KOEO) mode, I always scroll through the data to make sure that, among other items, the barometric pressure reading is correct for the altitude and that other pertinent KOEO data is correct for the application. To illustrate, if I’m looking at an OBD II Ford vehicle, I immediately check the baro reading.
Because the baro parameter identification data (PID) is a calculated value on most Ford products, an out-of range baro reading is a strong indicator of a dirty or malfunctioning mass air flow (MAF) sensor.
Next, if the vehicle has cold-soaked overnight, I check the inlet air and engine coolant temperatures to see if they’re nearly equal. Reading temp PIDs is much simpler than using a non-contact pyrometer to verify engine coolant temperature (ECT) and intake air temperature (IAT) sensor accuracy. These few examples illustrate how quickly even an average technician can spot poor sensor calibrations and hard failures without performing invasive testing.
Of course, if the PID is completely out of range and no DTC is stored, then it’s time to verify the validity of that PID with a digital multimeter (DMM) or digital storage oscilloscope (DSO). In most cases, PIDs that are completely out of range are caused by software errors in the scan tool itself. In other cases, the VIN has been entered incorrectly or the wrong programming key has been inserted into the scan tool cable.
Bias and Default Data Values
Occasionally, the scan tool displays a bias voltage or a default value when a sensor fails. Obviously, on OBD II vehicles, most types of sensor miscalibration or failure will also be accompanied by an applicable DTC.
On the other hand, recognizing a bias voltage or default value can be invaluable when diagnosing some sensor failures. Using a failure in a GM oxygen sensor circuit as an example, a 0.451 voltage value simply indicates that an open circuit exists in the oxygen sensor signal circuit. In some Chrysler products with a similar problem, a bias voltage value in the oxygen sensor circuit would be 5.0 volts.
In contrast to bias voltage, default values are those substitute values used by the PCM in the event the sensor is badly out of calibration or the sensor circuit has failed. If the PID doesn’t change or if it doesn’t correspond with the operation of the vehicle, it’s probably a default value, which, on OBD II vehicles, should be accompanied with an applicable DTC.
Last, when scan tool data is reviewed KOEO, the data values you see are default values that merely indicate that the sensor circuit is working. To illustrate, wheel speed sensor values are typically three miles per hour with the vehicle stopped. Mass air flow values might be “X” grams per second of air, even though the engine isn’t running. Although these values vary among manufacturers, keep in mind that they usually indicate that the sensor is connected and functioning normally at KOEO or when the vehicle’s at rest.
Trouble Code Rationalization
When reviewing stored trouble codes, always look at the rationality of the codes. At the basic level, the PCM “rationalizes” a trouble code by comparing multiple sensor inputs. A PCM, for example, can estimate mass air flow sensor performance by comparing throttle sensor and engine speed inputs. If the grams per second input from the MAF doesn’t match the engine speed and throttle opening, the PCM might store a MAF-related DTC.
Similarly, the PCM calculates the amount of time required for the engine to warm up by measuring engine speed and load. If the warm-up time exceeds the estimated time stored in the PCM’s memory, a coolant temperature-related trouble code is stored in the PCM’s diagnostic memory.
In most cases, multiple trouble codes stored in the PCM’s diagnostic memory should be related and demonstrate some type of rationale. In other words, if we see a series of DTCs that aren’t related or rational, the problem could be caused by a power failure at the ignition switch or a ground circuit failure at the PCM. Whether a DTC is stored or not depends upon the operating strategy programmed into the PCM, so always consult a manufacturer’s diagnostic chart or other information before jumping to conclusions when dealing with multiple diagnostic trouble codes.
Bidirectional Controls
Since the late 1990s, auto manufacturers have been building multiplexed electronics systems into their vehicles. At the basic level, Multiplexing means that a switch relays a command to a module or computer to activate a particular component like a windshield wiper, horn or similar “body control” components. Because modern body control components and wiring harnesses are often difficult to access, it’s much easier and faster to test these components by using the bidirectional features built into a professional-grade scan tool.
Always begin by polling each module for diagnostic trouble codes and recording these codes in a diagnostic notebook or on the repair order. Next, go to the “functional tests” or its equivalent to get into bidirectional testing modes. Once into bidirectional testing, experiment with the vehicle’s capability to activate components like the electric fuel pump, fuel injectors, ignition, and automatic transmission solenoids. When you become familiar with which bidirectional controls are available and how they work, you’ll find them to be a very valuable diagnostic tool.
On another note, bidirectional controls lend themselves very well to electric fuel pump testing on most vehicles. To illustrate, begin your next fuel pump diagnosis by checking for potential trouble codes and by activating the pump’s electrical circuit. If you can hear the solenoid click, you know the solenoid is being activated. If you can hear the fuel pump running, you know the fuel pump circuit is intact.
If you can test the amperage draw through the fuel pump fuse, you can determine the amperage flowing through the fuel pump. If the amperage is nearly zero, the tank might be dry, the fuel pump inlet filter clogged, or the pump shaft’s drive splines worn out. If the amperage is much higher than normal, the fuel filter might be clogged or the fuel pump pressure regulator stuck closed. The last step is to compare your electrical findings with a fuel pump pressure and volume gauge.
Yes, connecting a scan tool first seems like an extra step in the diagnostic process. But keep in mind that the scan tool is a non-invasive diagnostic process that allows you to verify the integrity of the fuel pump electrical circuit and gain an insight into the pump’s actual failure pattern. Attaching a scan tool, polling modules for diagnostic trouble codes, verifying various data streams, accessing diagnostic databases, and using bidirectional controls to diagnose even the most common system failures is the future trend of automotive diagnostics.